
Show points of transactions on price chart
closed
C
CT-kQE2vrDX
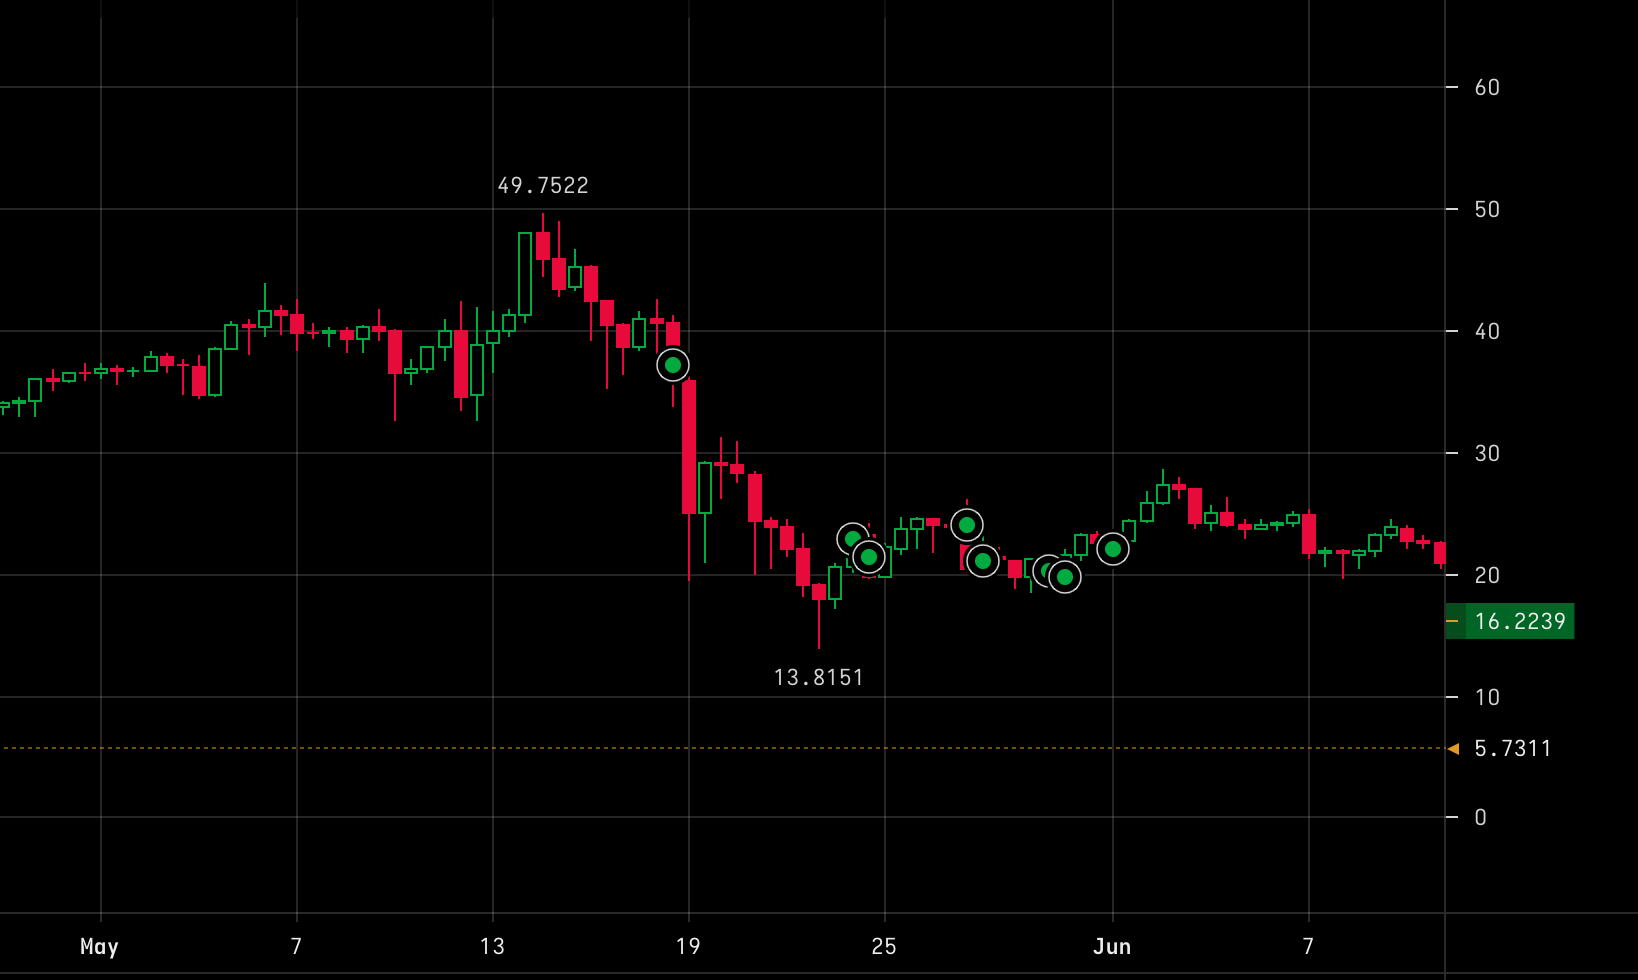
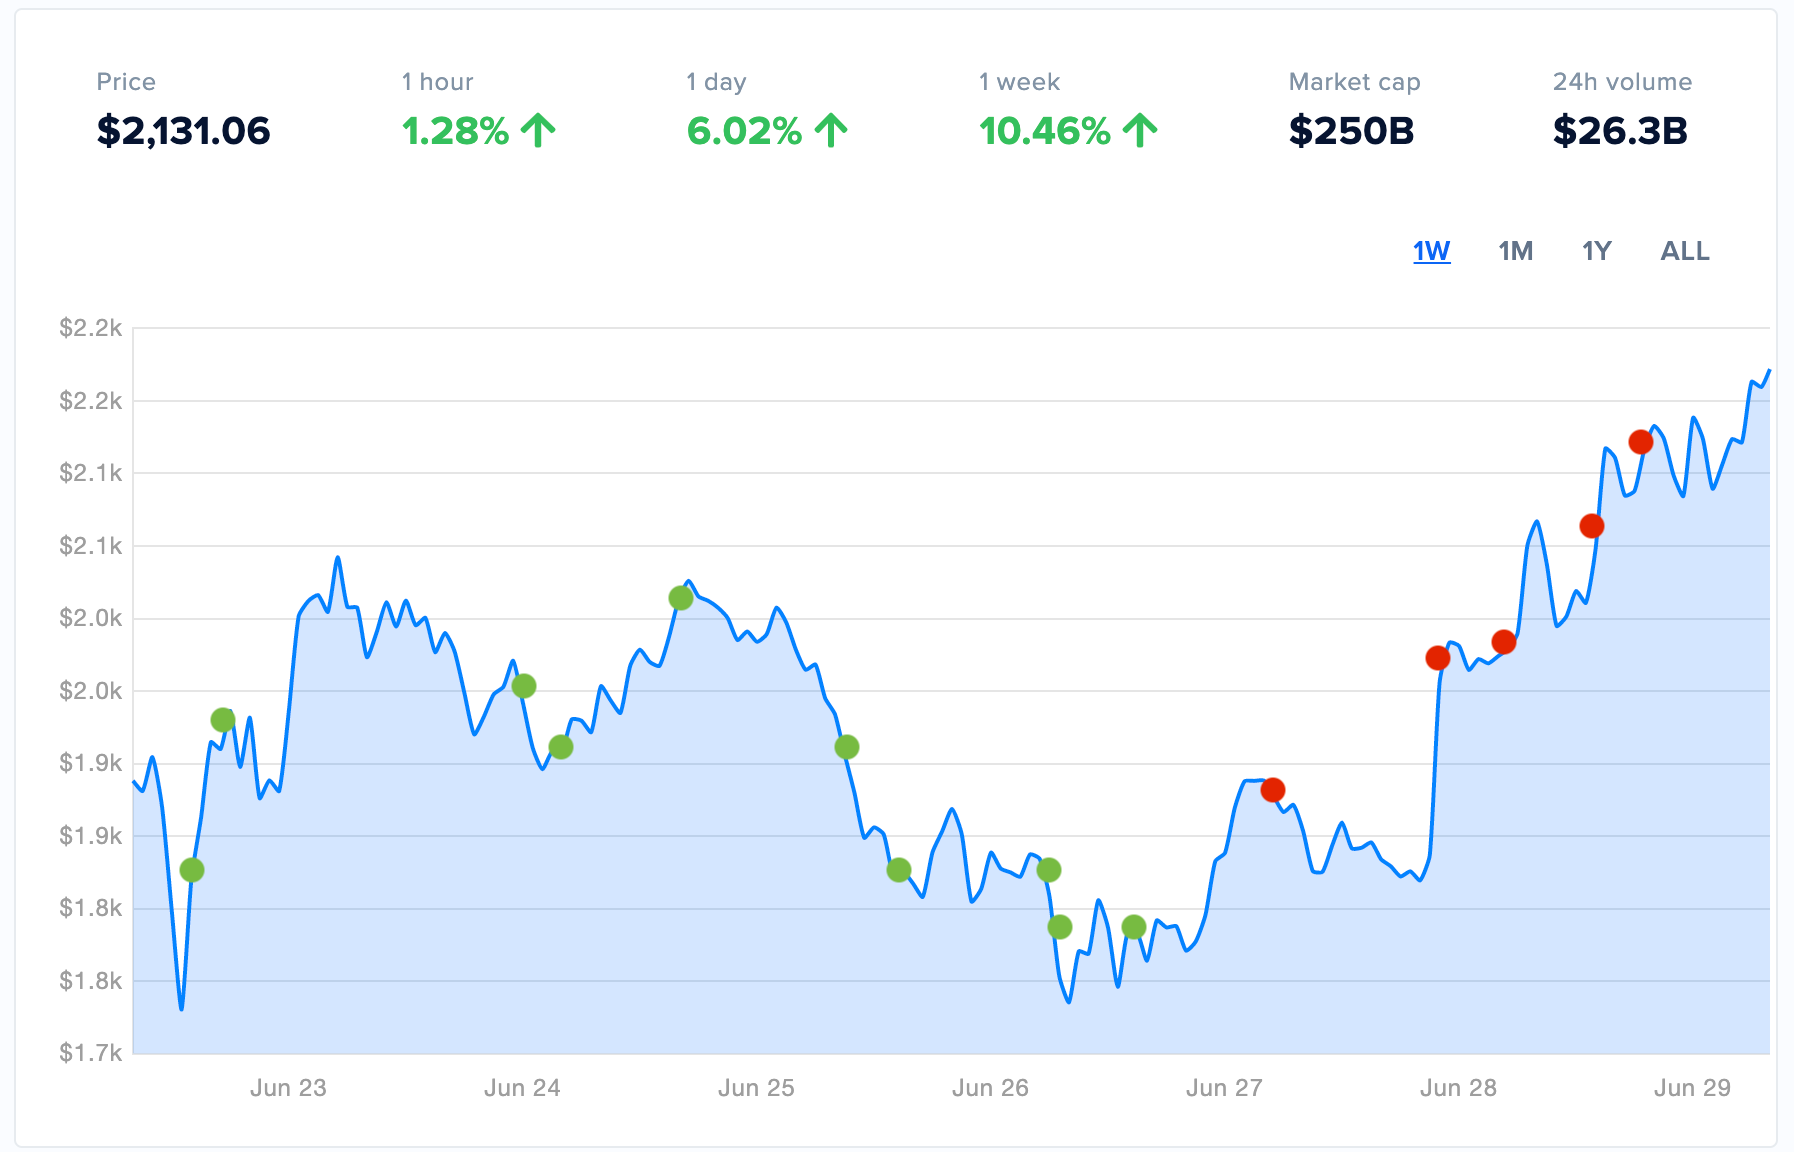
The site cryptowat.ch does this and I love it. I feel it helps to see where in the dips and climbs you got in or got out. In their implementation you only get to see a chart by coin by exchange (which makes sense because they show it down to the minute). But with CoinTracker I think it would be great to be able to see all the transactions of the same asset plotted on the same price chart, especially since you already list them all together as transactions below.
For example, if I bought/sold Polkadot on three different exchanges during the same month, it would be great to see those transaction points all show up on the same aggregated price chart for Polkadot.
Attached is a screenshot from Cryptowat.ch and rough mock-up of it could look like on CoinTracker
Log In

Sarah R - CoinTracker
closed
Sam - CoinTracker
closed
Thank you for your submission! We are conducting an audit of user feature requests on the CoinTracker feedback forum, in an effort to improve the user experience we will be archiving feature requests that have not had any activity either via comment or upvote for 24+ months.
If you would still like to request this feature please
re-submit this post
with updated details including any relevant links. We have implemented a new process to ensure all new submissions are triaged and captured appropriately. You can read more about how users can leverage the
CoinTracker feedback board here
.We look forward to serving you better!